Summary
MVSplat is a feed-forward model that reconstructs a scene as 3D Gaussians from as few as two images.MVSplat: Efficient 3D Gaussian Splatting from Sparse Multi-View Images. Chen, Xu, Zheng, Zhuang, Pollefeys, Geiger, Cham and Cai, 2024. arXiv:2403.14627 ↗ We train it on a synthetic dataset, Aria Synthetic Environments (ASE), and test it on real photos from RealEstate10K (RE10K). The score is clearly lower than for a model trained on RE10K itself. Adding frozen DINOv2 features to the encoder closes part of the gap. Replacing the cost volume with VGGT depth, or adding ground-truth depth supervision, did not help in our runs.
Background
Reconstructing a scene from a few views matters for robotics, AR/VR and navigation. NeRF gives high quality but needs per-scene optimization and many views. Generalizable models such as pixelNeRF and IBRNet instead learn scene priors from many scenes and infer a new one in one pass. pixelSplat applied this to 3D Gaussians, predicting them from an image pair. MVSplat extends that with a plane-sweep cost volume,A cost volume compares features from different views at many candidate depths. Where the features agree, the depth is likely right. which places Gaussians more accurately and gives state-of-the-art results on RE10K from two views. We use MVSplat as our backbone.
Real 3D ground truth is hard to collect at scale, so synthetic data is attractive. But models trained on it tend to struggle on real images because of differences in lighting, texture and noise. ContraNeRF, for example, targets this for NeRF-based view synthesis with a contrastive loss that enforces multi-view feature consistency.
We look at two pretrained models as sources of more robust information. DINOv2 is a vision transformer whose features work across image distributions without fine-tuning. VGGT predicts camera parameters, depth maps, point clouds and point tracks from images. We use DINOv2 as an extra feature input, and VGGT as a reference for depth and as a possible replacement for the cost volume.
Method
Datasets
- ASE (Aria Synthetic Environments) is synthetic and first-person. We corrected the image distortion and converted the cameras to MVSplat's format. It is our main training set.
- ADT (Aria Digital Twin) is real, recorded with Aria glasses in an apartment and an office, with 236 sequences. We use it to compare synthetic and real versions of the same environment.
- RE10K contains about 80,000 clips from roughly 10,000 YouTube videos, 10 million frames in total, with camera poses from SLAM and bundle adjustment. We use the usual 90/10 train/test split.
We also tried Hypersim and SceneNet. Neither suited our setting, as described in the appendix.
Training setup
The model predicts a set of 3D Gaussians, each with a position, opacity, covariance and color, and renders novel views from them. It is trained on ground-truth target images with a weighted sum of an ℓ2 loss and LPIPS.
Images are resized to 256 × 256. We report PSNR, SSIM and LPIPS, and train with Adam for 15,000 iterations unless stated otherwise.
Adding DINOv2 features
We add frozen DINOv2 features (ViT-L/14) to the architecture. They are fused with the CNN encoder outputs before the transformer block (Figure 2).
Replacing the cost volume
MVSplat's depth is noisy (see Results). We therefore remove the cost volume and depth refinement modules and use depth maps from a pretrained VGGT to position the Gaussians (Figure 4).
Depth supervision
ASE provides ground-truth depth, so we also add a depth loss next to the RGB losses. We try both ℓ1 and ℓ2, with weights of 0.1 and 0.25.
Results
Table and figure numbers follow the report.
The domain gap is clear
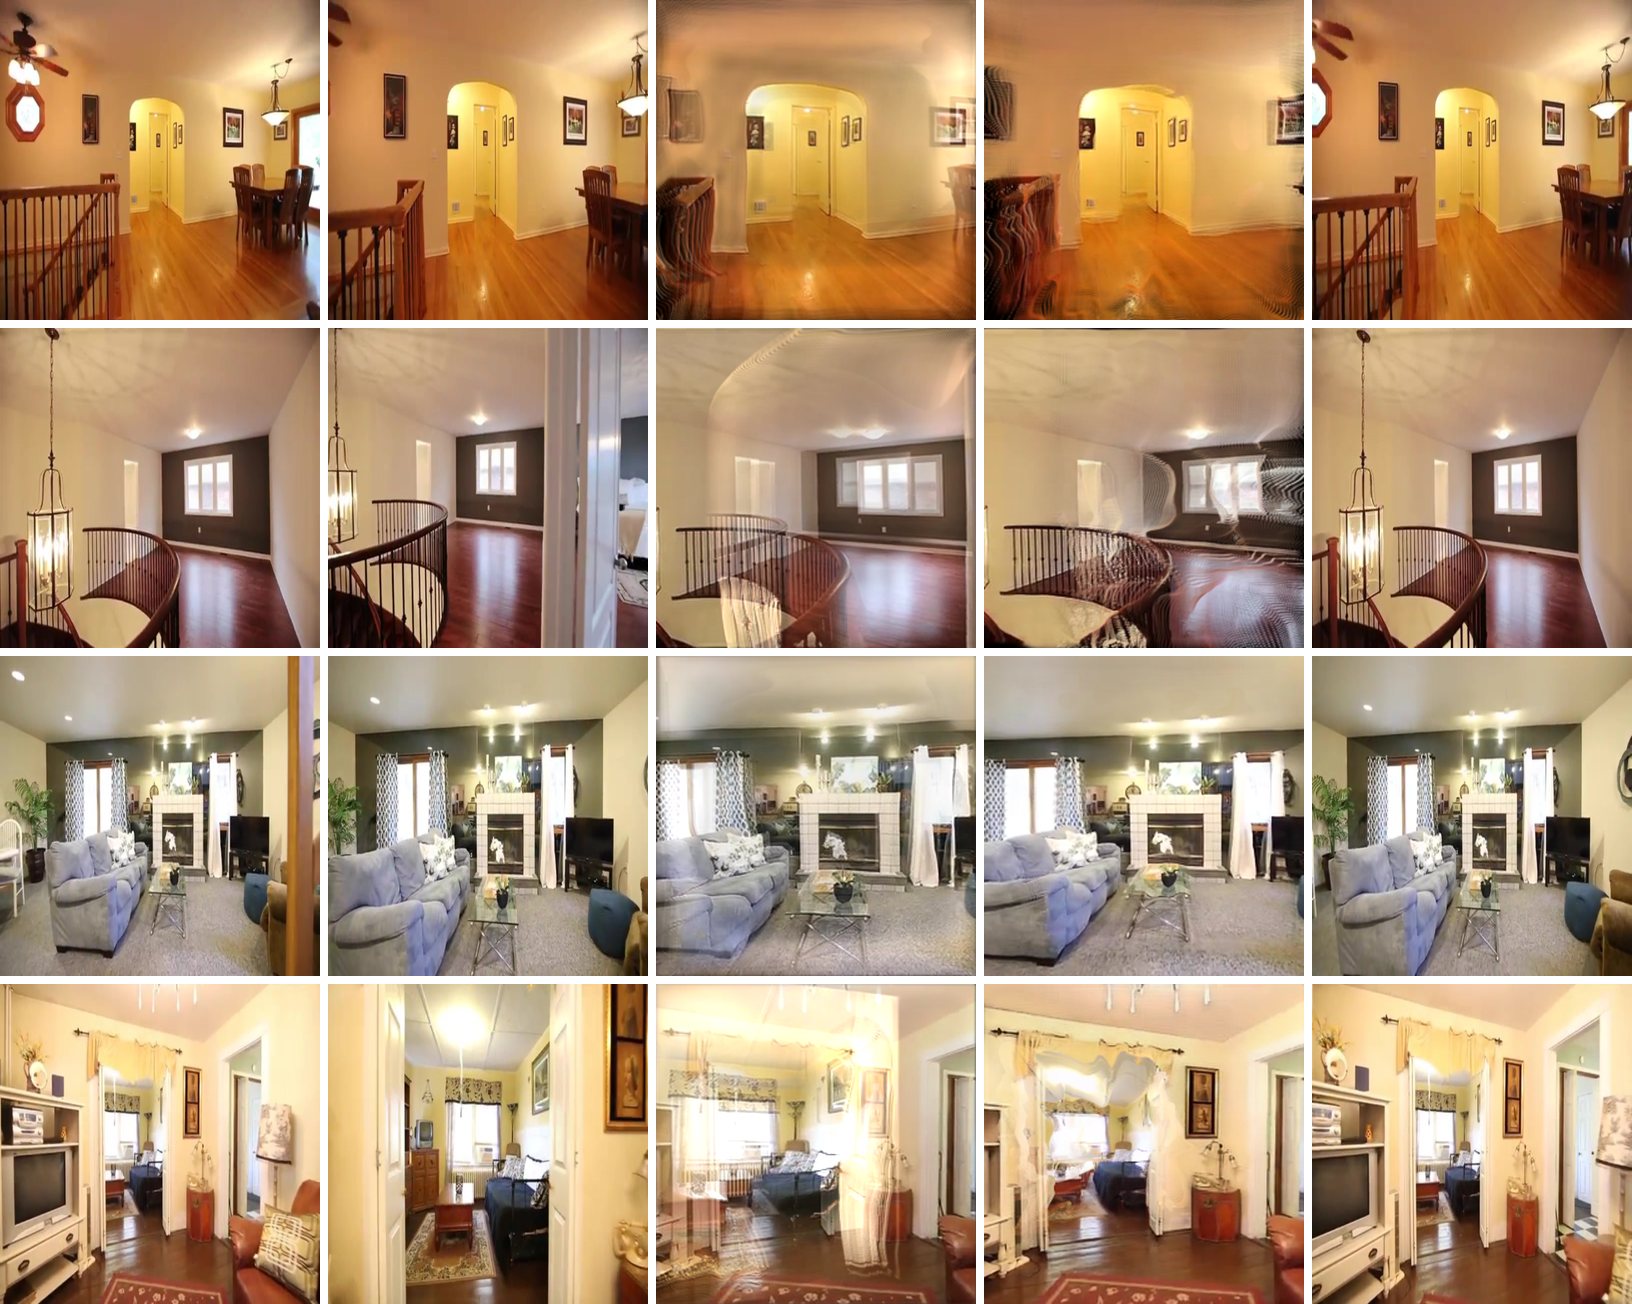
We train MVSplat on 56 scenes from ASE or from RE10K and test on 24 RE10K scenes. The RE10K-trained model does well. The ASE-trained model drops on all three metrics, from 17.44 to 15.63 PSNR and from 0.643 to 0.496 SSIM. In Figure 1 its reconstructions are blurrier and less accurate.
| Train → Test | PSNR ↑ | SSIM ↑ | LPIPS ↓ |
|---|---|---|---|
| ASE → RE10K | 15.63 | 0.496 | 0.402 |
| RE10K → RE10K | 17.44 | 0.643 | 0.354 |
DINOv2 features help
With DINOv2 features, results improve on both the synthetic and the real test set. On RE10K, PSNR goes from 16.76 to 17.43, SSIM from 0.561 to 0.598 and LPIPS from 0.361 to 0.335. The synthetic scores improve as well, by a smaller margin. Models trained on 400 ASE scenes also benefit from a longer schedule, 100,000 instead of 15,000 iterations. With 56 scenes, longer training gives no significant gain.
| Model | Test Set | PSNR ↑ | SSIM ↑ | LPIPS ↓ |
|---|---|---|---|---|
| Baseline | Aria (Synthetic) | 28.92 | 0.865 | 0.194 |
| RE10K (Real) | 16.76 | 0.561 | 0.361 | |
| DINOv2 | Aria (Synthetic) | 29.26 | 0.873 | 0.187 |
| RE10K (Real) | 17.43 | 0.598 | 0.335 |
More synthetic scenes help, mostly
We train on 56, 200 and 400 ASE scenes. Going from 56 to 400 raises RE10K PSNR from 15.63 to 16.12 and SSIM from 0.496 to 0.579. The step through 200 scenes is not monotonic on RE10K, where PSNR is 15.52 and LPIPS is 0.409, both slightly worse than with 56. We read the overall trend as a sign that both the diversity and the volume of synthetic data matter for cross-domain robustness.
| # Scenes | Test Set | PSNR ↑ | SSIM ↑ | LPIPS ↓ |
|---|---|---|---|---|
| 56 | Aria (Synthetic) | 26.48 | 0.798 | 0.242 |
| RE10K (Real) | 15.63 | 0.496 | 0.402 | |
| 200 | Aria (Synthetic) | 27.03 | 0.803 | 0.224 |
| RE10K (Real) | 15.52 | 0.505 | 0.409 | |
| 400 | Aria (Synthetic) | 27.69 | 0.818 | 0.226 |
| RE10K (Real) | 16.12 | 0.579 | 0.352 |
VGGT depth is cleaner than MVSplat depth
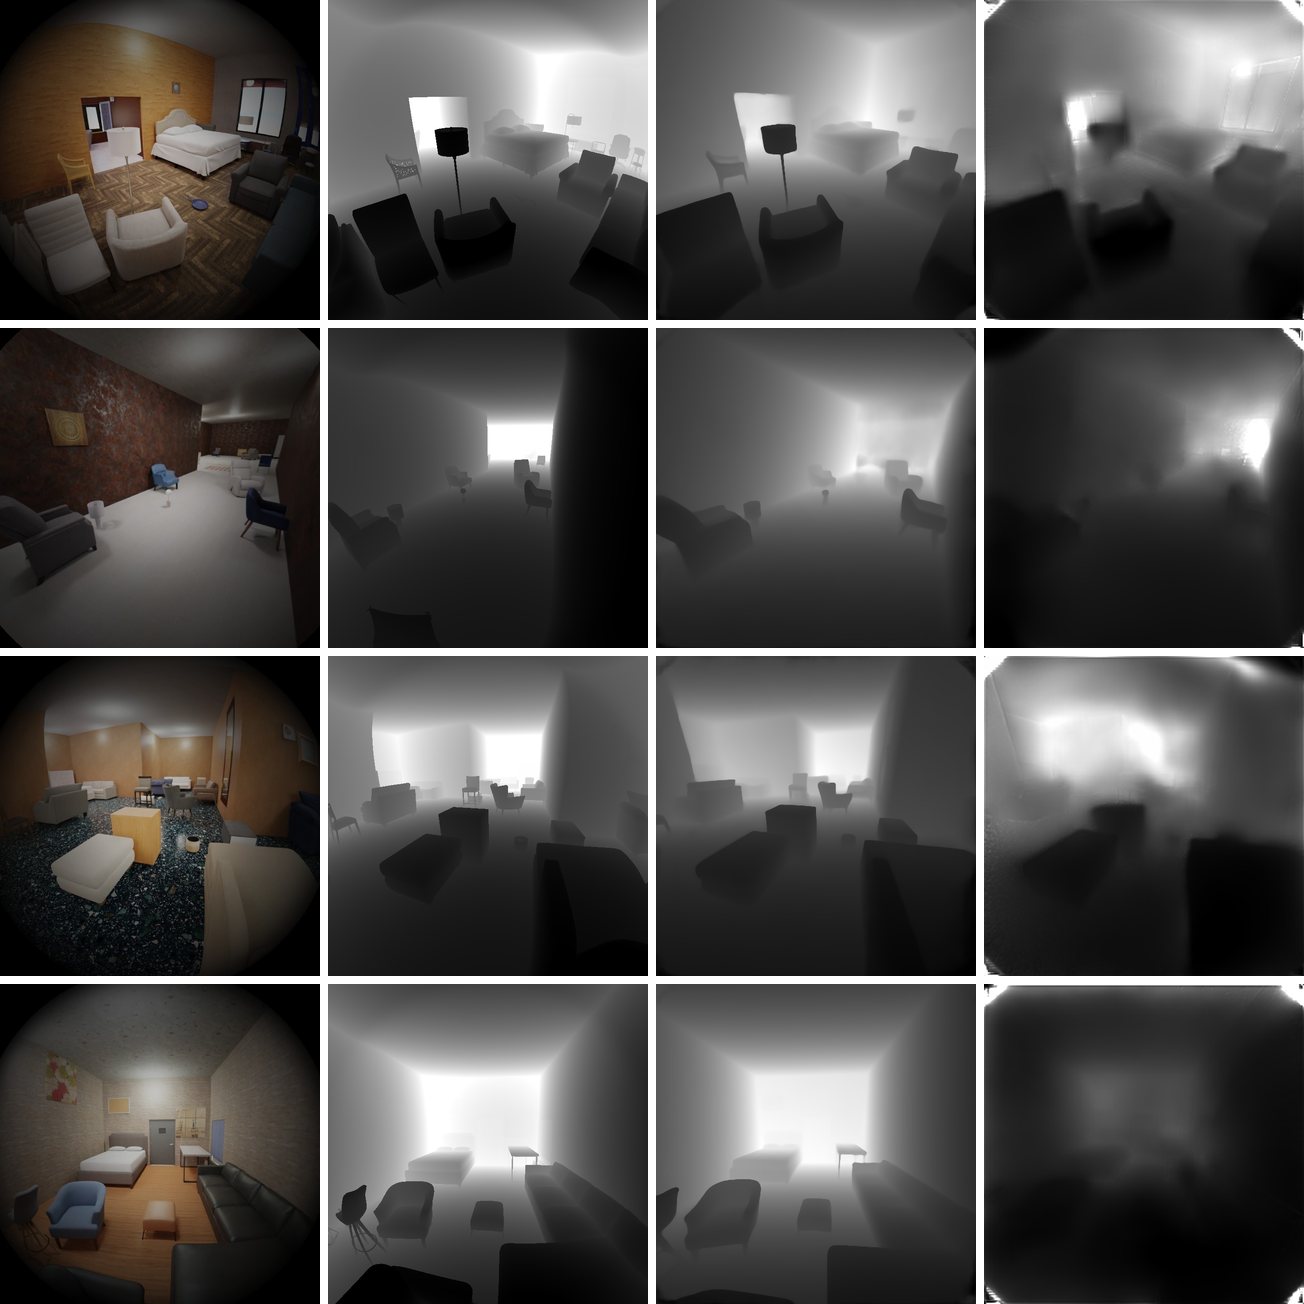
Artifacts such as blurry surfaces, missing regions and black patches often trace back to bad depth, so we compared depth maps directly. Figure 3 shows four scenes. VGGT depth stays closer to the ground truth and keeps room structure and object boundaries. MVSplat recovers the overall layout but is noisier and misses fine detail. In Table 3 VGGT is better on RMSE, RMSE log and δ1, while MVSplat has the lower AbsRel.
| Method | AbsRel ↓ | RMSE ↓ | RMSE log ↓ | δ1 ↑ |
|---|---|---|---|---|
| MVSplat | 1.641 | 54.02 | 0.999 | 0.300 |
| VGGT | 2.017 | 31.35 | 0.769 | 0.495 |
Removing the cost volume did not work
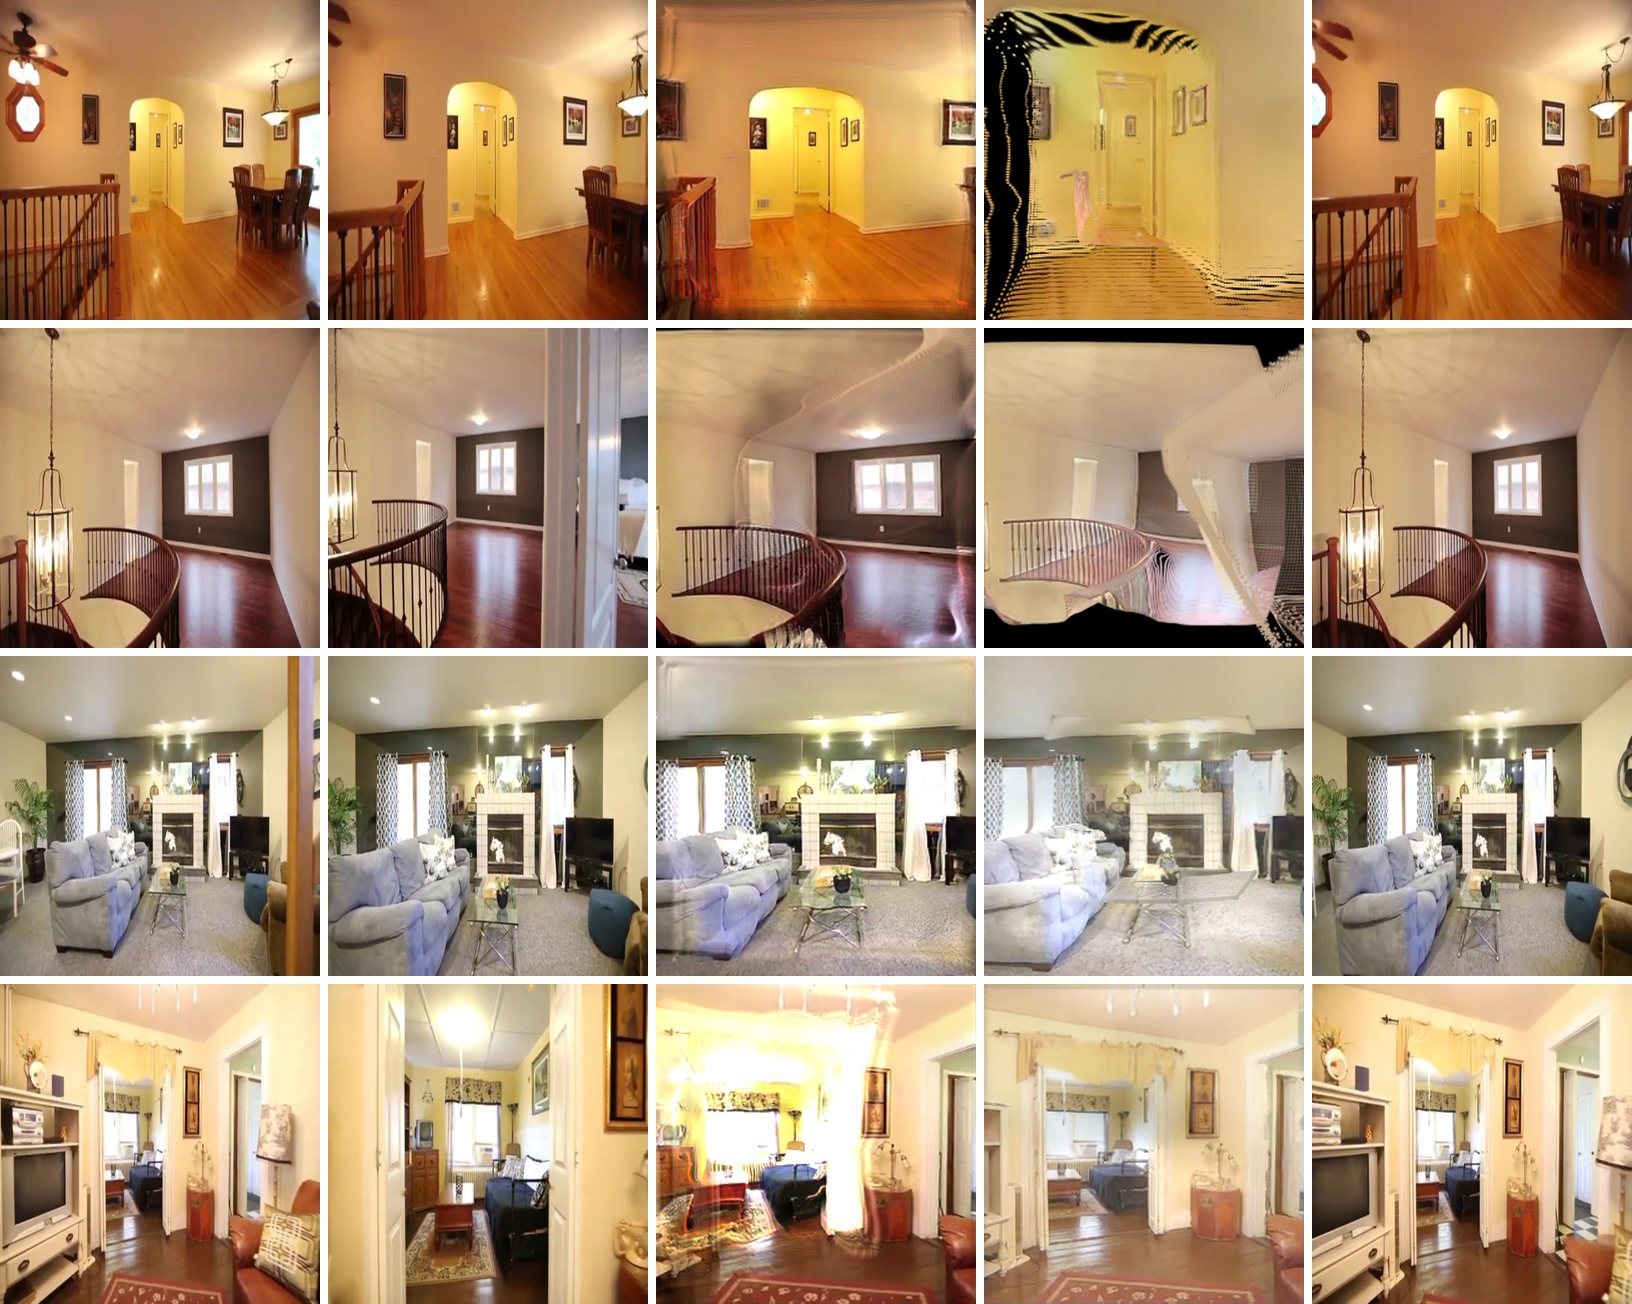
With VGGT depth in place of the cost volume, training does not converge properly. On RE10K, PSNR falls from 16.64 to 11.47 (Table 4, Figure 5). In the original MVSplat, depth is learned implicitly through the photometric loss, which corrects depth, color and opacity together. With fixed pretrained depth, inconsistencies between views cannot be corrected. The input depth looks accurate, yet the rendered images are misaligned and the photometric loss stops being useful. Directly using pretrained depth without refinement is therefore not enough. Possible fixes are to fine-tune the depth model with a cross-view consistency loss, or to let the model adjust the depth it receives.
| Model | Test Set | PSNR ↑ | SSIM ↑ | LPIPS ↓ |
|---|---|---|---|---|
| MVSplat | ASE | 28.2 | 0.82 | 0.21 |
| RE10K | 16.64 | 0.567 | 0.356 | |
| Ours | ASE | 21.8 | 0.63 | 0.45 |
| RE10K | 11.47 | 0.345 | 0.547 |
Depth supervision did not help either
We compare the MVSplat baseline with four depth-loss variants. None beats the baseline on RE10K PSNR or on Aria PSNR. A few other numbers improve slightly. The ℓ2 loss with weight 0.1 has the highest RE10K SSIM (0.503), and the ℓ2 variant with weight 0.05 applied after 20,000 iterations has the best Aria SSIM and LPIPS. Overall the gains are small and the picture is mixed.
| Loss Type (Weight) | Test Set | PSNR ↑ | SSIM ↑ | LPIPS ↓ |
|---|---|---|---|---|
| MVSplat | RE10K | 14.79 | 0.466 | 0.417 |
| Aria | 27.86 | 0.825 | 0.222 | |
| ℓ1 (0.1) | RE10K | 13.74 | 0.410 | 0.455 |
| Aria | 25.13 | 0.779 | 0.255 | |
| ℓ1 (0.25) | RE10K | 12.99 | 0.394 | 0.475 |
| Aria | 24.97 | 0.768 | 0.265 | |
| ℓ2 (0.1) | RE10K | 12.86 | 0.503 | 0.418 |
| Aria | 25.78 | 0.817 | 0.250 | |
| ℓ2 (0.05, after 20k) | RE10K | 14.34 | 0.490 | 0.425 |
| Aria | 27.48 | 0.848 | 0.219 |
A first look at Aria Digital Twin
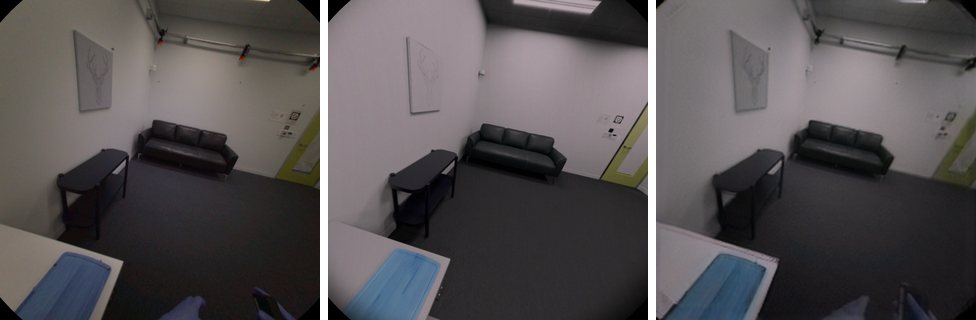
ADT has synthetic and real renderings of the same environments. We overfit the model on one synthetic scene and test it on the matching real scene (Figure 6). Layout and geometry agree across the three images, but lighting, shading and texture differ. The model gets the placement of furniture and walls right. The prediction is slightly blurrier, less sharp and brighter than the real image. So the model generalizes somewhat from synthetic training alone, but loses fine detail and texture.
Conclusion
- Domain gap. MVSplat trained on ASE scores clearly below the same model trained on RE10K, when tested on RE10K.
- Features. Frozen DINOv2 features improve results on real data, and on synthetic data by a little.
- Depth. VGGT depth is cleaner than MVSplat depth by most measures, yet using it in place of the cost volume, or supervising with ground-truth depth, did not improve reconstruction.
Limitations. The experiments use small training sets, from 56 to 400 scenes, and short schedules. The depth findings are on indoor scenes only.
Future work. The report suggests fine-tuning the depth model with a cross-view consistency loss, or letting the model adjust the depth it is given. Optimizing depth and appearance jointly still looks important for the best results.
Appendix
A. Hypersim
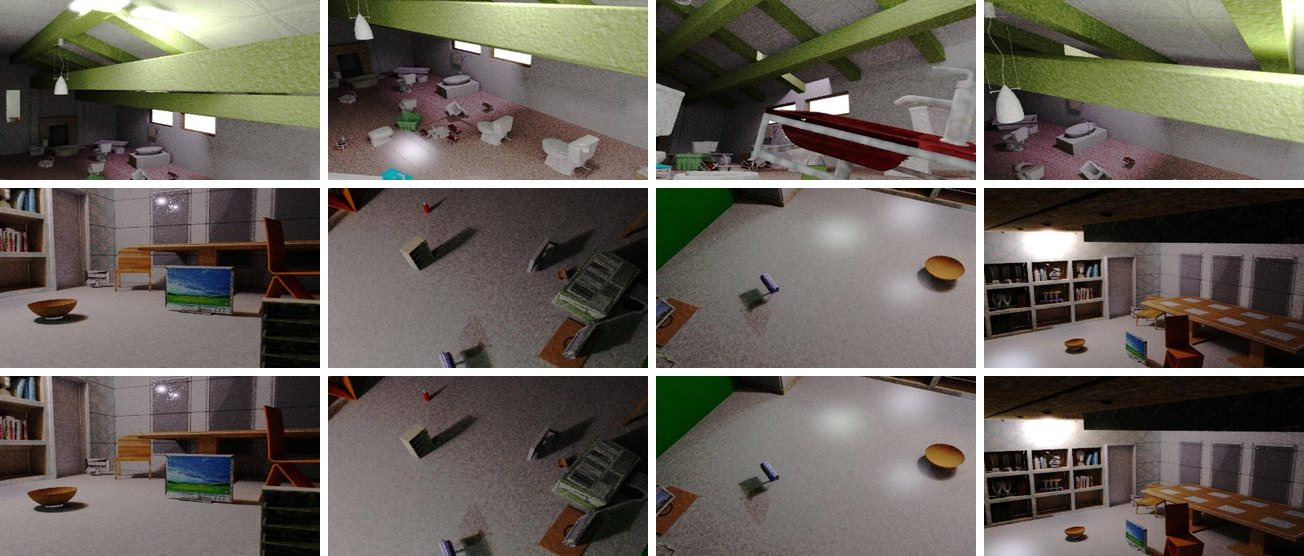
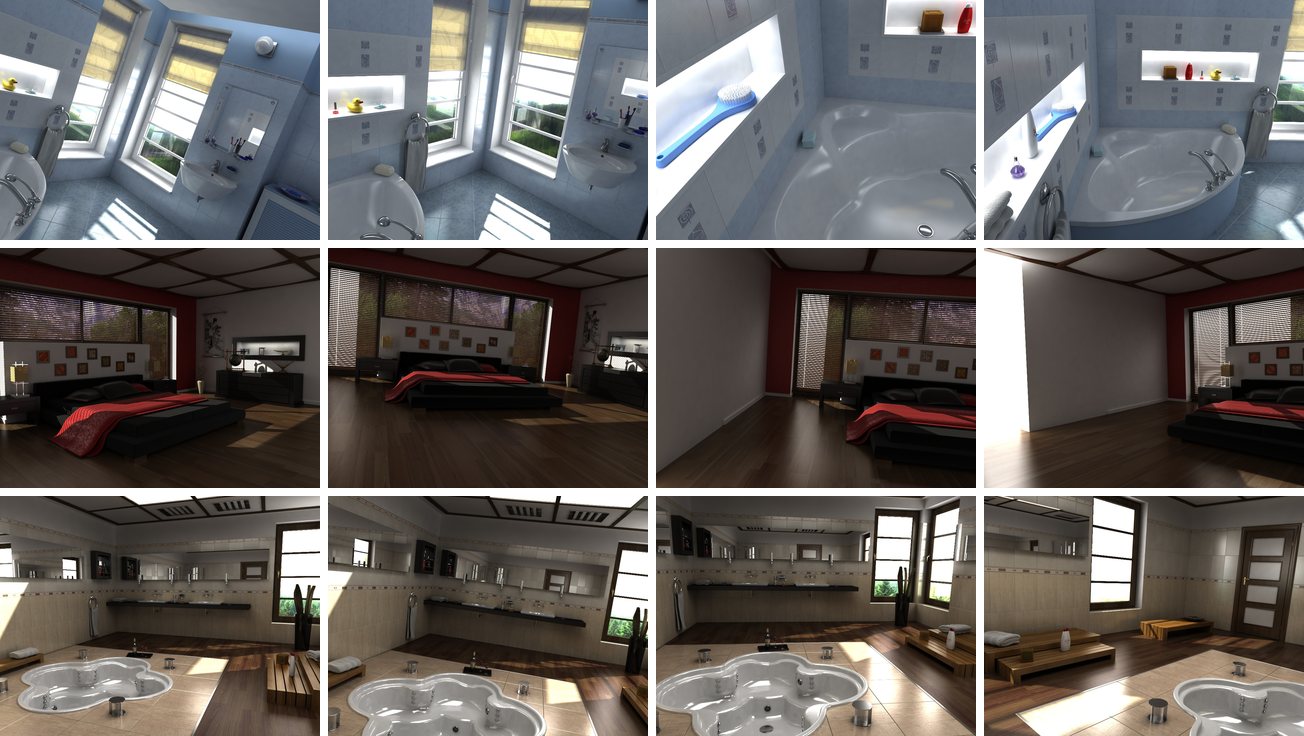
Hypersim is a large synthetic indoor dataset built from 3D scans of real environments, with ground truth for depth, normals and instances. It did not fit sparse-view reconstruction. Its images are scattered snapshots from different viewpoints rather than frames of a continuous trajectory, so neighboring views overlap very little. MVSplat then has trouble finding geometric correspondences and produces incomplete reconstructions with black patches, especially in low-texture areas. Sorting images by viewing direction to build pseudo-sequences helped a little (Figure 8) but not enough.

B. SceneNet
SceneNet is a 2017 synthetic dataset of randomly generated indoor scenes rendered from several viewpoints. The scenes are simple, with a few low-texture objects, plain lighting and materials, and little fine structure. Models trained on it generalize poorly to real images. It was still useful for our first experiments, where we could train models and reproduce results on RE10K. We then switched to more realistic synthetic data, ASE.